
What a good P/E ratio is? This question often sparks intriguing discussions among financial experts and investors. The Price-to-Earnings (P/E) ratio, also known as the earnings multiple, is an essential tool used to evaluate a company’s stock price against its earnings per share.
In this guide, we’ll explore the P/E ratio’s role in stock valuation and how various factors affect its value, with Tesla’s higher-than-average PE ratios as a case study to illustrate what high versus low values signify.
We’ll demystify what high versus low P/E ratios signify using Tesla’s higher-than-average PE ratios as a case study while highlighting how investor sentiments can impact these values.
We’ll take you through forward P/E ratios to provide insights into future performance expectations for companies. Moreover, understanding industry norms and their influence on determining what constitutes a good PE ratio will be covered comprehensively.

The blog post further dissects the company’s financial health through Earnings Per Share(EPS), discusses investing in companies with relatively higher PE values, and introduces advanced metrics like the PEG Ratio and Shiller PE for a more nuanced assessment of valuations.
In essence, by examining all these elements closely, you will gain clarity about what makes up a good p/e ratio from different perspectives – equipping you with better judgment when making investment decisions.
Understanding the Price-to-Earnings Ratio
The PEG ratio uses the trailing P/E ratio and divides it by a company’s earnings growth over a specified period of time. The Price-to-Earnings Ratio (P/E Ratio) is a critical tool for investors and analysts to determine a stock’s value.
It’s like a Tinder profile for stocks, indicating how much investors are willing to pay per dollar of earnings. However, what constitutes a good P/E ratio can vary depending on several factors such as industry norms and investor expectations for future earnings growth.
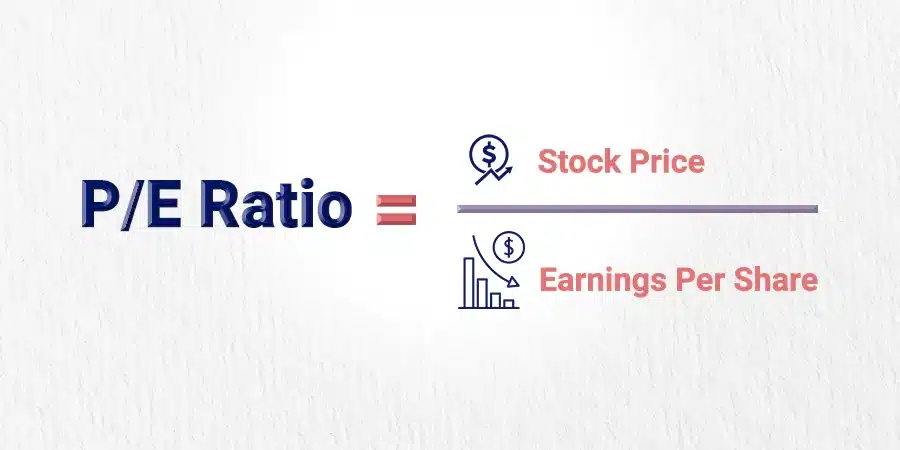
In simple words, The price-to-earnings ratio is the ratio for valuing a company that measures its current share price relative to its earnings per share (EPS).
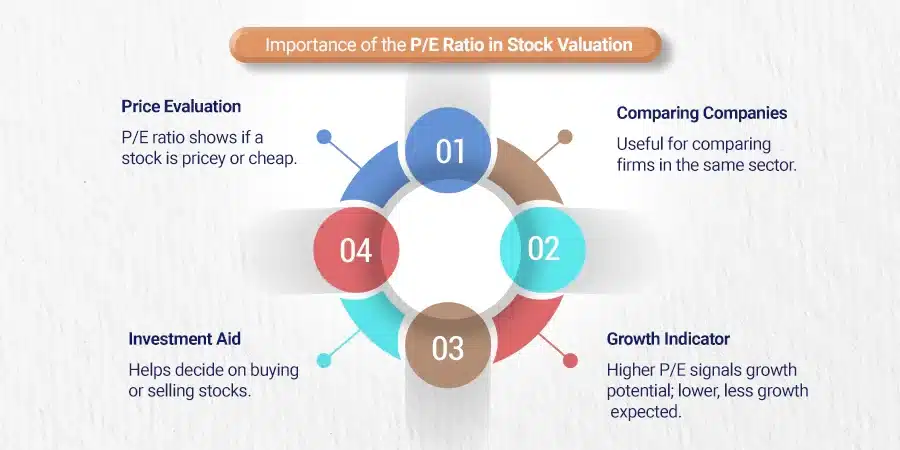
Importance of the P/E Ratio in Stock Valuation
The P/E ratio is one of the most common metrics to judge a stock’s valuation. The P/E ratio is a much-employed tool for evaluating if the company’s stock is priced too high or not.
It’s like a crystal ball that helps you understand if you’re paying too much for what could be low returns or getting an excellent deal on potentially high returns.
Factors Influencing the Value of P/E Ratios
- Economic conditions: In booming economies, companies have high PE ratios due to increased investor confidence.
- Growth prospects: Companies with strong future growth projections tend to have higher than average P/E ratios because investors expect more substantial profits down the line.
- Risk profile: Higher-risk companies usually command lower P/E ratios than expected growth since they present greater chances of loss to shareholders.
In essence, determining what makes up a good P/E ratio isn’t always straightforward” It depends heavily on context and specific circumstances surrounding each investment opportunity.
Therefore, it’s crucial that prospective investors understand these influencing factors when using this important financial metric as part of their decision-making process.
To ensure sound investment decisions at Quadra Wealth, we believe in empowering our clients through knowledge sharing about essential investing concepts like P/E ratios.
Our goal is not just about providing consistent growth but also helping them become financially independent through structured notes and informed investment choices based on comprehensive market analysis and insights.
Key takeaways
The Price-to-Earnings Ratio (P/E Ratio) is a critical tool for investors to determine a stock’s value, and it varies depending on industry norms and investor expectations. The P/E ratio helps assess whether a company’s share price is overpriced or underpriced, but this metric depends heavily on context and specific circumstances surrounding each investment opportunity. Quadra Wealth empowers clients through knowledge sharing about essential investing concepts like P/E ratios to make informed investment choices based on comprehensive market analysis and insights.
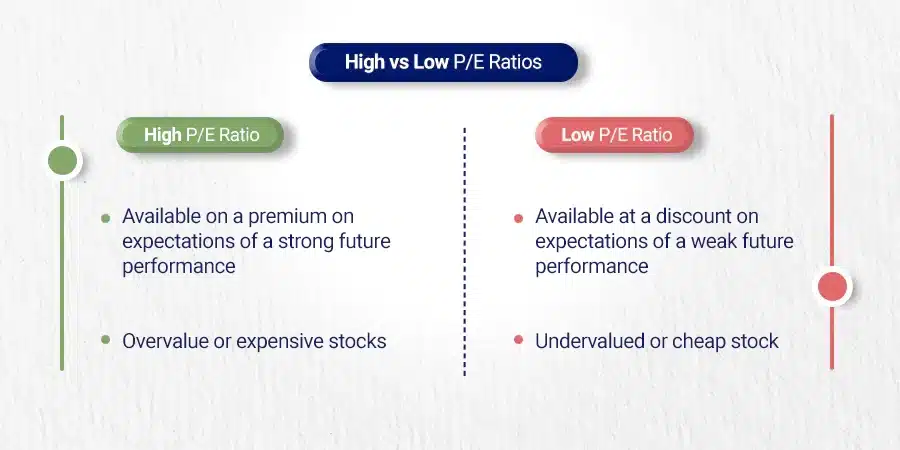
High vs Low P/E Ratios – What They Mean?
A high or low price-to-earnings (P/E) ratio doesn’t solely indicate whether a stock is overvalued or undervalued. It’s essential to comprehend that these metrics are impacted by a variety of elements, including the organization’s development possibilities and market standards.
Case Study: Tesla’s Higher Than Average PE Ratios
Take Tesla, for instance. Despite having higher than average P/E ratios, it continues to attract investors.
This can be attributed to its anticipated high future earnings growth. If investors believe that future company earnings will surpass current levels while the price of a stock remains constant, then we would see rising P/E ratios – an indication of positive sentiments towards prospective profitability.
Impact of Investor Sentiments on PE Values
Investor attitude is a major factor in calculating P/E ratios. A company with strong projected growth often has a higher-than-average P/E ratio as investors anticipate increased profits in the future and are willing to pay more for each dollar of the company’s earnings today.
- Bullish sentiment: When there is optimism about a company’s potential performance, this could lead to an increase in its share prices and subsequently result in higher P/E values.
- Bearish sentiment: Conversely, if there is pessimism surrounding the company’s outlook due to reasons like poor financial health or unfavorable market conditions, it may drive down share prices leading to lower P/E values.
The key takeaway here is not just focusing on numerical value but understanding what drives these numbers behind the scenes. It provides valuable insights into investor expectations about the firm’s future profitability, which ultimately influences their investment decisions.
Therefore, it becomes essential for expatriates residing in the UAE interested in investing in equities through Quadra Wealth to have a comprehensive understanding of how to interpret P/E values before making any decision.

Key takeaways
Understanding P/E ratios is crucial for investors, as it can provide valuable insights into investor expectations about a firm’s future profitability. A high or low pe ratio is not the sole indicator of whether a stock is overvalued or undervalued and is influenced by various factors like growth prospects and industry norms. Tesla has higher than average P/E ratios due to its anticipated high future earnings growth, which attracts investors who believe that future earnings will surpass current levels while the stock price remains constant.
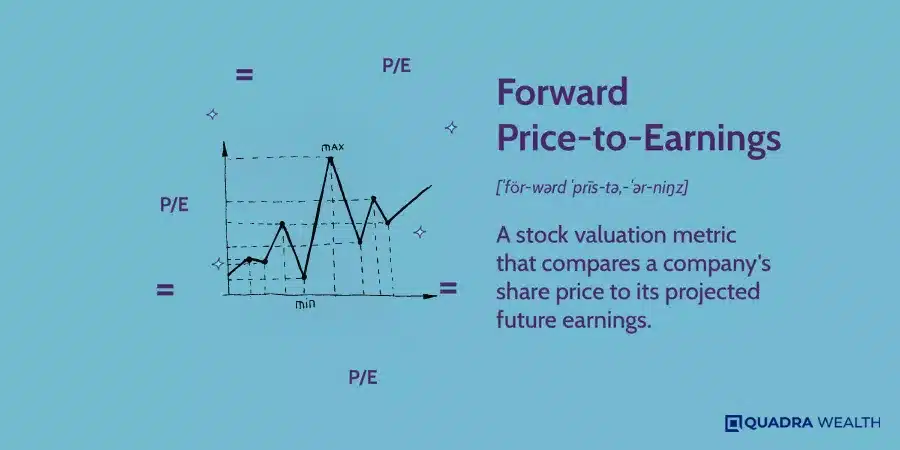
Forward Price-to-Earnings Ratio – What is a Good P/E Ratio
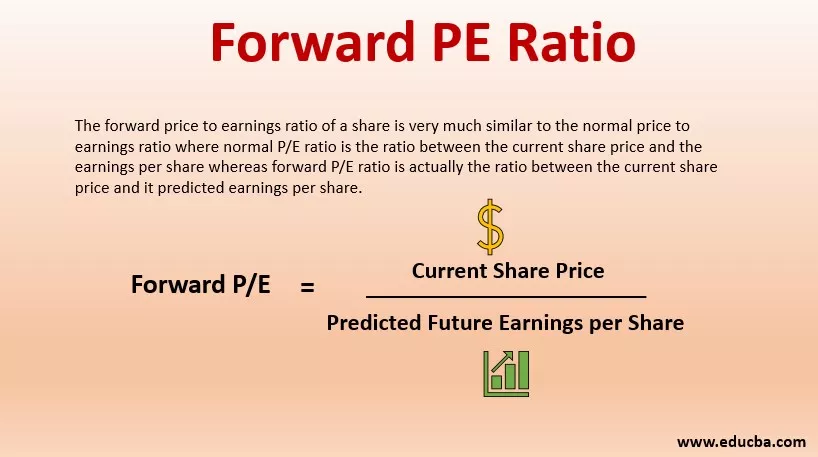
The forward price-to-earnings (forward P/E) ratio is a powerful tool for savvy investors. Unlike the traditional P/E ratio, which only considers past earnings, the forward P/E ratio takes into account projected earnings.
This makes it a more insightful metric for predicting future financial market outcomes.
Calculating Forward PE Ratios
Divide the current share price by the projected EPS for the coming 12 months to determine the forward P/E ratio. Keep in mind that these are estimated figures and not guaranteed results. Analysts’ predictions or company guidance reports are often used to make these calculations.
A lower forward P/E suggests that a stock may be undervalued based on its predicted growth rate. Conversely, a higher value could indicate overvaluation if those projections don’t materialize.
Implications of Forward PE Ratios on Investment Decisions
The beauty of using this metric lies in its ability to provide insights beyond what past performance can tell us. For instance, consider two companies with similar current P/E ratios but different forward P/Es – Company A has a lower forward P/E than Company B due to stronger anticipated growth rates.
In such scenarios, despite their identical present valuations as indicated by their current P/E ratios, investing in Company A might seem more attractive because it appears poised for greater profitability going ahead as reflected through its lower prospective P/E values. (source)
Therefore, when assessing the attractiveness of investing in Company A based on their P/E ratios, other factors such as market conditions and sector trends should be taken into account to ensure the accuracy of the estimates.
Despite their potential volatility, it is essential to take into account these metrics when making investment decisions as other factors such as market conditions and sector trends should also be taken into consideration. (source)
Industry Norms and Their Influence on Good P/E Ratio
Comparing the financial performance of different companies can be done effectively by using the price-to-earnings (P/E) ratio. Therefore, a “good” P/E ratio can be determined by the norms of each sector.

The Role of Sectoral Norms in Determining Good P/E Levels
Different sectors have unique characteristics that influence their typical P/E ratios. For instance, technology companies often have higher average P/Es due to rapid growth expectations while utility firms may exhibit lower ratios because of their stable but slow-growing nature.
Investopedia’s guide on Price-to-Earnings Ratios provides an excellent overview of how industry norms can impact these values.
Avoiding Misleading Comparisons Between Different Industries Based on P/E Values
When analyzing stocks from various industries using the P/E ratio, it is important to not make decisions based solely on this metric.
A high-tech company with a high P/E might be growing rapidly and investing heavily in R&D, whereas a manufacturing firm with a low P/E could be experiencing slower growth but generating consistent profits.
The Balance’s article on Using The P/E Ratio offers more insights into why cross-industry comparisons can sometimes lead to misleading interpretations.
In order to make accurate evaluations when considering investment opportunities across diverse sectors, one should consider other factors such as future earnings projections, balance sheet strength, and market conditions alongside the P/E ratio.
It would also be beneficial if investors familiarize themselves with sector-specific dynamics by referring to resources like the Corporate Finance Institute piece on Industry Norms.
This approach will provide you with a comprehensive understanding of each company’s potential for long-term success rather than relying solely upon short-term valuation metrics like the P/E ratio, which might not fully reflect underlying business realities or future prospects.
Key takeaways
The P/E ratio is a useful tool for investors, but what constitutes a “good” ratio can vary by industry. Different sectors have unique characteristics that influence their typical ratios, and it’s important to avoid making misleading comparisons between companies from different industries based solely on the P/E value. Investors should consider other factors such as future earnings projections, balance sheet strength, and market conditions alongside the P/E ratio when evaluating investment opportunities across diverse sectors.
Maximizing Company Financial Health through Earnings Per Share (EPS)
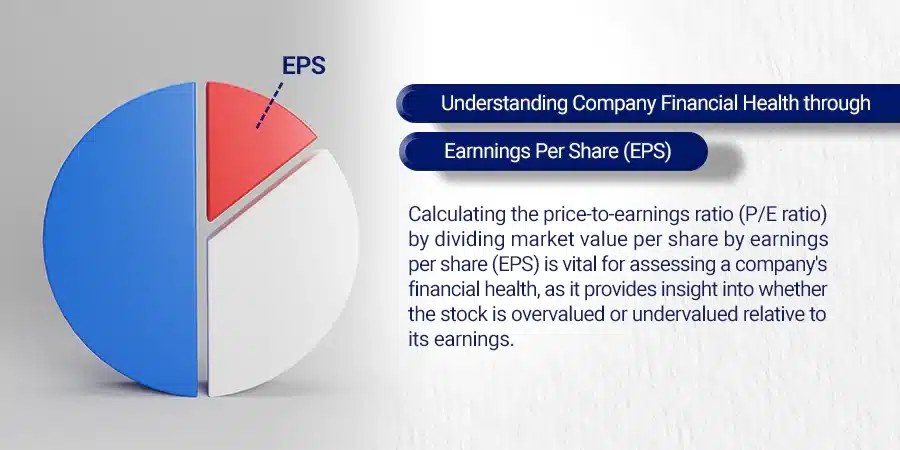
Determining a company’s financial well-being via its Earnings Per Share (EPS) is essential for calculating the corresponding price-to-earnings ratio.
The ratio formula involves dividing the market value per share by EPS. Here’s why it’s crucial in determining good P/E values.
Calculation Methodology for Accurate PE Using EPS
Divide the present market cost of a stock by its earnings per share (EPS) to get an accurate P/E value.
If you’re looking at a specific period, use that period’s average stock price and net income to find your EPS figure. Simple, right?
Significance of EPS in Evaluating a Company’s Financial Health
Earnings Per Share is an indication of a company’s profitability on a shareholder basis. Higher numbers typically indicate better performance and potential returns on investment. It also plays an essential role in calculating other key metrics like P/E ratios.
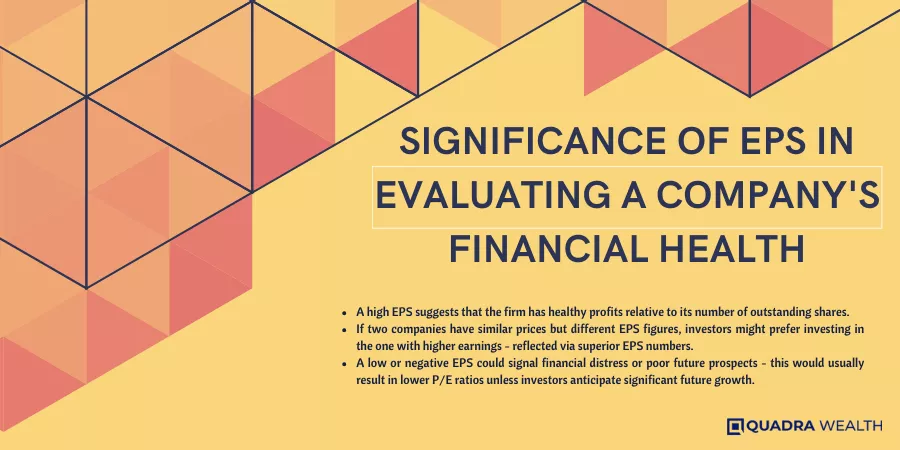
- A high EPS suggests that the firm has healthy profits relative to its number of outstanding shares.
- If two companies have similar prices but different EPS figures, investors might prefer investing in the one with higher earnings – reflected via superior EPS numbers.
- A low or negative EPS could signal financial distress or poor future prospects – this would usually result in lower P/E ratios unless investors anticipate significant future growth.
Understanding both P/E ratios and Earnings Per Share provides investors with critical tools for assessing corporate financial health while making informed decisions about their investments.
It helps them ascertain if they’re paying too much for what they’re getting return-wise from their chosen stocks based on each dollar earned by those companies.
Remember though: every investor’s situation is unique, so always consider seeking advice from professionals before making any major decisions.
Key takeaways
The article explains how to calculate a company’s price-to-earnings (P/E) ratio using its earnings per share (EPS), which is an indicator of its financial health. A high EPS suggests healthy profits, while a low or negative EPS could signal financial distress. Understanding both P/E ratios and EPS provides investors with critical tools for assessing corporate financial health before making informed decisions about their investments.
Up For Investments With Relatively Higher PE – Is It Worth It?
In the world of investing, it’s common to come across companies with relatively higher price-to-earnings (PE) ratios.
These entities often exhibit less volatility and are perceived as more stable investments. However, their seemingly expensive valuations might make some investors hesitate.
Benefits And Risks Associated With Investing In Companies Having Higher PE
The appeal of investing in businesses with elevated P/E ratios can be found in the possibility of reliable expansion and dependability.
Often these businesses have a proven track record of profitability and robust financial health which justifies their elevated valuation Investopedia explains here.
On the flip side, a higher P/E ratio can also indicate overvaluation which could lead to disappointing returns if the company fails to meet investor expectations.
- Risk Mitigation: High P/E stocks typically belong to established firms with consistent earnings growth reducing investment risk.
- Growth Potential: They may offer substantial upside potential given that they’re expected to continue growing at an above industry average rate.
- Potential Overvaluation: A high P/E ratio might suggest that a stock market is overpriced relative to its earnings capacity posing downside risks should market sentiment change or if company performance falters.
Deciding When To Pay Up: Balancing Risk Appetite And Return Expectations
Your decision on whether or not you should invest in high-P/E stocks largely depends on your individual risk tolerance and return expectations.
If you’re willing to pay a premium for potentially superior returns while understanding associated risks, then such investments could be worth considering.
As always, it’s crucial to do thorough research before making any investment decisions The Balance provides tips here.
To summarize, while high-P/E stocks can appear pricey initially, they often represent quality businesses capable of delivering impressive results over time.
Therefore, don’t let sticker shock deter you from exploring these opportunities; instead, focus on understanding the underlying fundamentals driving those valuations ensuring alignment with your personal investment goals.
Remember, successful investing isn’t about finding the cheapest options but rather identifying value where others may not see it.
Key takeaways
Investing in companies with high P/E ratios can be beneficial due to their potential for steady growth and stability, but it also comes with risks such as overvaluation. It’s important to balance your risk appetite and return expectations before investing in these stocks and thoroughly research the underlying fundamentals driving those valuations. Don’t let sticker shock deter you from exploring these opportunities; instead, focus on identifying value where others may not see it.
Peg Ratio – Beyond Conventional pe Metrics
Looking for a more comprehensive view of a company’s earnings? The Price/Earnings to Growth (PEG) ratio is here to help. It’s a refined version of the P/E ratio that considers the expected earnings growth rate of a company’s earnings.
Unlike traditional methods, PEG includes future predictions, providing better investment insights.
Calculating Peg And Its Advantages Over Traditional Methods
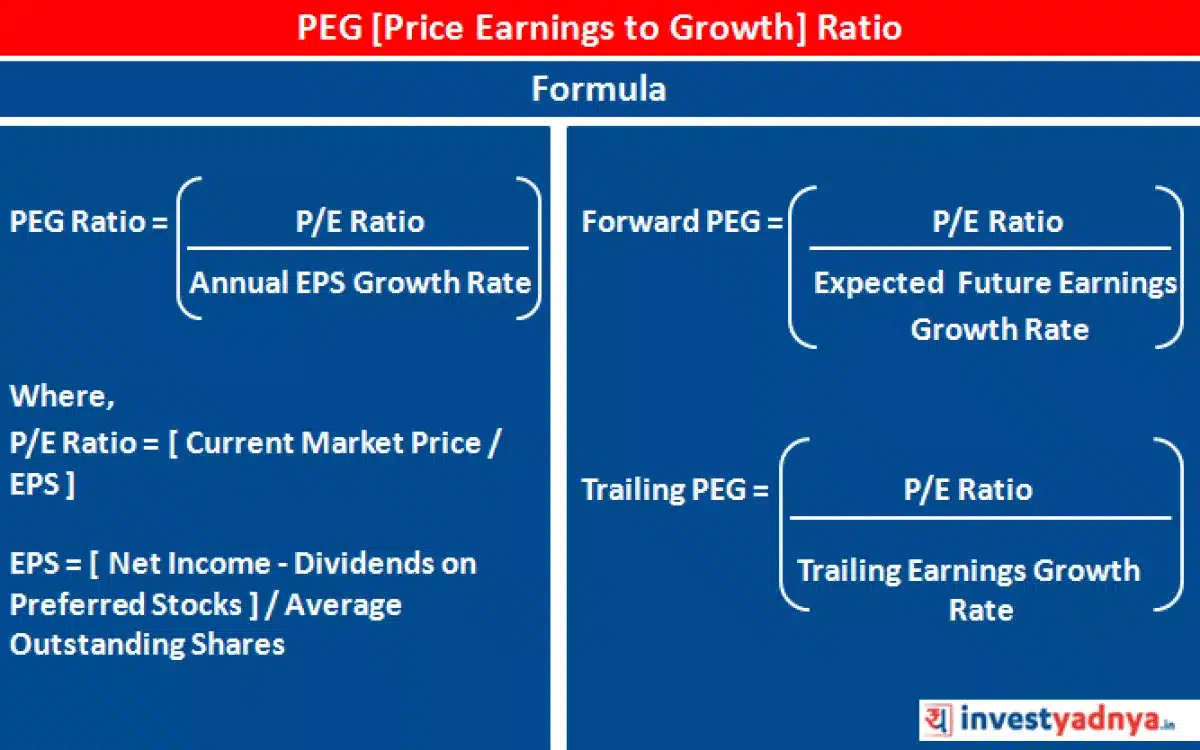
To calculate the PEG ratio, divide the P/E ratio by the annual EPS growth rate. A quick way to see if a stock is undervalued or overvalued.
The P/E-to-growth ratio may show if a stock could be overpriced or undervalued taking into account its future profit potential. For instance, if Company A has a high P/E but also high projected earnings growth, it could still have a low (and potentially attractive) PEG ratio.
- Advantage 1: Traditional methods only consider past and present data, but PEG includes future predictions, providing better investment insights.
- Advantage 2: PEG helps identify undervalued stocks with strong future earning potentials, aiding in making informed decisions.
Assessing Fair Pricing Using Predicted Growth Rate Through Peg
Companies with lower PEG ratios, relative to their peers within the same industry sector, might be considered underpriced given their predicted earning capacity.
This can help investors find hidden gems – stocks that are priced relatively low compared to their intrinsic value based on anticipated earnings performance.
Remember, don’t rely solely on one measure while making investment decisions.
Other factors such as market conditions and company-specific risks should also be taken into consideration for a balanced portfolio management approach at Quadra Wealth.
Assessment of Valuations through Shiller PE
In finance, sometimes you need a softer approach to valuations. The Shiller PE provides a comforting embrace during times of market turbulence when more rigid metrics can become unreliable and misleading.
It’s like a gentle hug during times of extreme volatility when traditional metrics might freak out and distort the true picture.

Shiller PE Calculation Methodology
The Shiller PE calculation methodology, also known as cyclically adjusted price-earnings (CAPE), is different from standard P/E ratios.
It uses ten years’ worth of earnings data to provide a long-term, cyclically-adjusted perspective that helps avoid short-term distortions caused by business cycles.
To calculate this measure:
- Determine real per-share earnings over a ten-year period.
- Calculate average inflation-adjusted earnings for each year within this timeframe.
- Divide the current market value per share by these averaged values.
Navigating Extreme Volatility Using Shiller Metric
The Shiller metric is useful during periods of high volatility because it smooths out fluctuations resulting from cyclical changes in profit margins or other factors affecting corporate profits. It offers investors an alternative view on valuation that can be more reflective of underlying fundamentals rather than being influenced heavily by temporary trends or shocks.
This doesn’t mean that you should ignore conventional P/E ratios entirely. Instead, use them alongside CAPE for better understanding and comparison across different timeframes.
Remember, just like any financial indicator, neither method guarantees future performance nor eliminates risk completely. They’re simply tools providing additional insight into potential investment opportunities.
Conclusion
When it comes to investing, empowering yourself with an absolute understanding of the P/E ratio is key – it can give you valuable insights into a company’s financial health and growth potential.
But remember, the Price to Earnings ratio is just one metric to consider – you should also look at EPS, industry norms, and investor sentiment.
Tools like forward P/E ratios, PEG ratios, and Shiller PE ratios can empower you to get a more comprehensive understanding of a company’s valuation.
So, if you want to make informed investment decisions, make sure you’re taking all of these factors into account and empower yourself to seize the best opportunities.
Frequently Asked Questions
The value of a P/E ratio is relative and depends on industry norms and growth expectations, but a P/E ratio of 30 could be considered high for slow-growth industries and reasonable for high-growth sectors like technology. Learn more about P/E ratios.
How do I calculate a P/E ratio?
The PE ratio is calculated by dividing the current market price of one share by its earnings per share (EPS). For example, if Company XYZ has an EPS of $2 and the current stock price of one share is $20, then its P/E ratio would be 10 ($20/$2).
What P/E ratio does Warren Buffett use?
Warren Buffett doesn’t strictly adhere to a specific P/E ratio, but he prefers companies with consistent earnings growth, which often have lower P/E ratios. Learn more about Warren Buffet’s investment strategy.
The average historical ratio of the S&P 500 index has had an average trailing twelve-month (TTM) P/E around 15-16 times, so it can be considered a standard level. Check out historical S&P500 averages.
Is a high P/E ratio good or bad?
A higher-than-average P/E might indicate overvaluation, but it could also suggest expected future growth, while a low P/E may imply undervaluation or poor future performance. Understand high & low P/E ratios.