
Sarah, a young college graduate, was eager to invest in stocks. With some savings (yeah, she managed!) and a healthy dose of optimism, she set her sights on a promising tech startup.
Investment in this start-up was zeroed after discussing with a few colleagues similar to her age.
The company’s innovative product had garnered positive buzz and was the talk of the investing town.
Sarah and her colleagues believed it had the potential for exponential growth.
Excited by the prospect of quicker and higher returns, Sarah poured a significant portion of her savings into the stock.
But weeks turned into months, and the story wasn’t exciting anymore. While the company’s news remained positive, the stock price seemed stagnant.
Sarah tried to sell some shares to recoup some of her investment, but to her surprise, there were no buyers.
This is a typical story for many start-up investments!
What is Liquidity in the Stock Market?
In simple terms, liquidity refers to the ease with which an asset, such as stocks, can be bought or sold in the market without significantly affecting its price.
Think of liquidity as the “flow” of trading activity – high liquidity means there are many buyers and sellers actively participating in the market, making it easier to execute trades quickly and at a fair price.
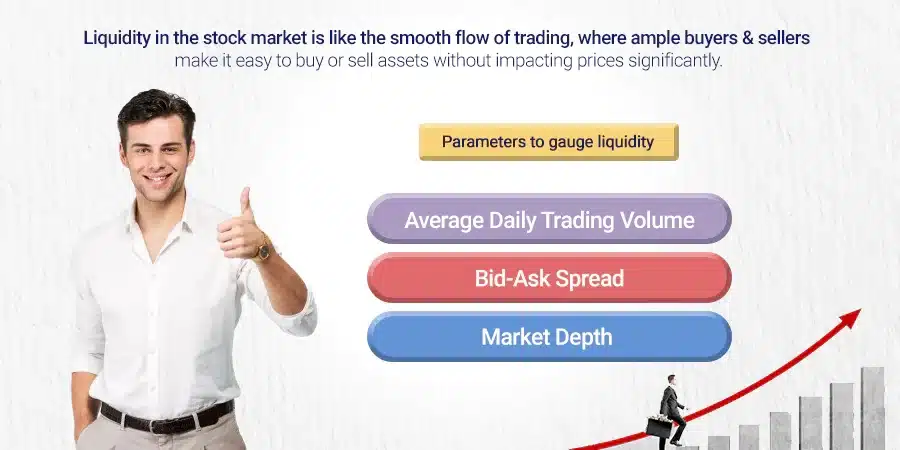
Parameters to gauge liquidity
The behavior of stocks when analyzed through the lens of a few parameters gives a sense of liquidity moving around them. Let us understand them.
Average Daily Trading Volume
This parameter measures the average number of shares traded per day over a pre-defined standard period, usually, it is 30 days.
Stocks with higher average daily trading volumes are generally considered more liquid, simply because there’s more trading activity, reducing the risk of price manipulation and making it easier for investors to buy or sell shares without affecting the market price.
Bid-Ask Spread
The bid-ask spread is the difference between the highest price a buyer is willing to pay (bid) and the lowest price a seller is willing to take (ask).
A narrow bid-ask spread indicates tight competition between buyers and sellers, which indicates higher liquidity.
Conversely, a wide bid-ask spread suggests lower liquidity and higher trading costs.

Market Depth
Market depth refers to the number of buy and sell orders at various price levels beyond the best bid and ask prices.
Stocks with greater market depth have more liquidity because more buyers and sellers are willing to transact at different price levels, providing greater price stability and smoother trading.
Liquidity Ratios for exact measurement
These ratios weigh cash and its equivalents at any given point against its liabilities.
These ratios give us an exact measurement of the liquidity of the stocks.
A ratio of one indicates it has more assets than liabilities. Asset calculation is slightly differentiated in these ratios.
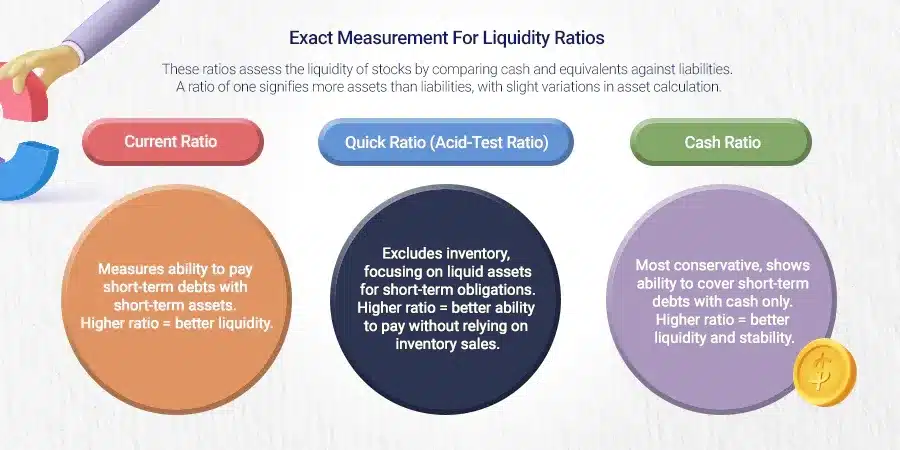
Current Ratio:
The current ratio is a liquidity ratio that measures a company’s ability to pay its short-term obligations with its short-term assets.
It’s calculated by dividing current assets by current liabilities.
A higher current ratio indicates better liquidity, as it means the company has more current assets to cover its current liabilities.
Quick Ratio (Acid-Test Ratio):
Similar to the current ratio, the quick ratio measures a company’s ability to cover its short-term liabilities, but it excludes inventory from current assets since inventory may not be as liquid.
It’s calculated by subtracting inventory from current assets and then dividing it by current liabilities.
A higher quick ratio indicates better liquidity and suggests that the company can meet its short-term obligations without relying on selling inventory.
Also Read: Why Are Financial Ratios Important?
Cash Ratio:
The cash ratio is the most conservative liquidity ratio, as it measures a company’s ability to cover its short-term liabilities with its cash and cash equivalents only.
It’s calculated by dividing cash and cash equivalents by current liabilities.
A higher cash ratio indicates greater liquidity and financial stability, as the company has more cash on hand to cover its short-term debts and obligations.
Why liquidity in the stock market matters
Liquidity in the stock market matters for several reasons. It impacts both individual investors and the overall market health:
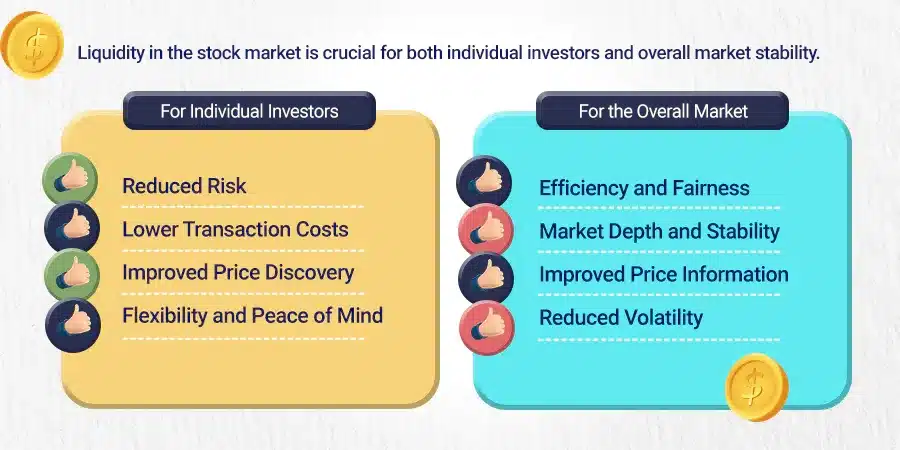
For Individual Investors:
- Reduced Risk: High liquidity allows you to exit positions quickly and easily, minimizing the risk of being stuck in a stock when you need the cash. This mitigates the impact of unexpected expenses or changes in your financial situation.
- Lower Transaction Costs: When there are many buyers and sellers, bid-ask spreads tend to be narrower. This means you pay less per trade, maximizing your returns.
- Improved Price Discovery: Active trading leads to a more accurate reflection of a stock’s true value through constant price adjustments. This minimizes the risk of overpaying or underpaying for a stock.
- Flexibility and Peace of Mind: Knowing you can readily convert your holdings to cash provides greater peace of mind and allows for more flexible investment strategies.
For the Overall Market:
- Efficiency and Fairness: High liquidity ensures smooth and efficient execution of buy and sell orders, preventing large price swings and promoting fair market prices.
- Market Depth and Stability: Liquid markets attract more investors, increasing overall participation and depth, which contributes to market stability and resilience against shocks.
- Improved Price Information: Active trading generates continuous price updates, reflecting new information and developments related to the company or the broader market.
- Reduced Volatility: Liquidity dampens excessive price fluctuations, creating a more predictable and investor-friendly environment.

Liquidity gone for a toss; examples
The allure of high-growth potential attracts many investors to lesser-known, smaller companies.
Sometimes, the gamble pays off, but other times, investors find themselves in a fix, stuck in illiquid stocks. Here are a few examples, from where we can learn caution.
1. The Biotech Bust: Remember Zyla Pharmaceuticals? In 2015, its stock price skyrocketed when the company promised to have discovered cancer treatment drugs.
A unique proposition with a noble cause, investors jumped in. However, the treatment failed clinical trials, and the stock plunged into oblivion.
Zyla’s low trading volume meant selling shares became a slow process, leaving many investors holding onto depreciating assets.
2. The Penny Stock Pitfall: Microcap companies often trade for mere pennies per share, attracting bargain hunters.
But be warned! Their low share price often indicates low liquidity. Take, for example, Enron’s pre-scandal days.
While its stock price was low, its daily volume was insignificant.
When the scandal hit, investors were left scrambling to sell practically worthless shares and the market had no buyers for it.
3. The SPAC Mirage: Special Purpose Acquisition Companies (SPACs) raise money through IPOs to later acquire another company.
The initial excitement can lead to significant price jumps. However, if the target acquisition falls through or disappoints, investors might find themselves holding onto a SPAC with limited prospects and low trading volume, making an exit challenging.
4. The Regional Regret: Smaller, regional companies can offer unique investment opportunities.
However, their limited geographic reach often translates to lower liquidity. Investors who bought heavily into a local brewery chain, for instance, might face difficulties finding buyers outside their region, especially if the company’s performance falters.
5. The Pump-and-Dump fiasco: Be wary of sudden surges in stock prices fueled by online hype or social media campaigns.
These “pump-and-dump” schemes often target illiquid stocks, creating an artificial buying frenzy.
Once the hype fades, the price falls drastically, leaving unsuspecting investors trapped with illiquid holdings.
Parting thoughts
These are just a few examples of how illiquidity can turn an investment dream into a nightmare.
Remember, before investing in any stock, especially less-established companies, thoroughly research its liquidity, including average daily trading volume and bid-ask spreads.
Prioritize your risk tolerance and diversify your portfolio to avoid getting stuck in the depths of illiquid stocks.
The stock market is full of exciting opportunities, but one has to walk carefully to understand the potential pitfalls, and liquidity is an important factor to consider.