Introduction
As a newbie investor who wants to sign up with a said investment firm, you should refer to Key Performance Indicators, or KPIs. This way, you would know if the company is doing well or not. KPIs refer to indicators or metrics that determine if the investments company is doing well for itself and catering to its customers on a positive note.
These indicators, in other words, refer to measurable values on investments that are used to evaluate the success and performance of investment strategies, portfolios, or individual assets. This way, investors can make well-informed investment decisions that align with their financial goals on a more holistic note indeed.
On this parlance, let us move on to identify the potential KPIs For Investments on a detailed note. Helping you get started here:
Return on Investment or RoI
Return on Investment or RoI refers to returns an investor earns through his investor portfolio. This is the formula that applies good while you calculate your RoI.

Here, the net profits of the investment is calculated. This figure is divided by the cost of the investment portfolio multiplied by 100. It is the ROI that attracts investors to invest in stocks or shares of a company.
Net Present Value or NPV
The Net Present Value, or the NPV, refers to the future value of cash flows. This value is subtracted from the initial investment an investor makes. The more positive the NPV is, the better it is for the investor.
Internal Rate of Return or IRR
IRR is the point at which the NPV is 0. This is an important metric that is used in evaluating investment opportunities. The higher the IRR is, the better it is for you to consider an investment opportunity with a said firm.
Annualized Return
This is a metric that standardizes returns across different timeframes. Using this particular metric, you can compare different investment opportunities that come to you with varying timelines.
Volatility- Also Known as Standard Deviation
This is a metric that measures the overall risk factor for an investment portfolio. For instance, higher volatility refers to an investment portfolio that can garner better returns on investments over regular trading options. At the same time, you can also incur potential losses. The lower the volatility the better it is for an investor.
Sharpe Ratio
Sharpe is an investment metric that evaluates returns on investment vs the risk of the portfolio. The higher the Sharpe ratio is, the better the portfolio is risk-adjusted.
Here is the formula for the computation of the Sharpe Ratio:

Alpha
Alpha is a KPI metric that measures the excess returns you receive over the requisite benchmark. Here, if you get a positive alpha, then your investment portfolio has outperformed its benchmark after risk adjustments have been made on the same.
Beta
Beta refers to a metric that typically measures the sensitivity involved in market movements. If you get a Beta that equals one, then the investment portfolio is moving in sync with market movements. On the contrary, if the value is greater than 1, then the portfolio becomes a highly volatile one.
Dividend yields
Dividend yields refer to the share of profits an enterprise shares with shareholders for that annual year. Dividend payouts for a firm are made to shareholders annually. Here is the formula that is used to compute the same:

This is an important metric that signals how much income an investor makes over his equity assets like stocks, shares or a basket of high-paying securities.
Expense Ratio
This is a metric that typically applies to ETFs or Mutual Funds. Lower ratios are generally preferred amongst investors mainly because higher fees erode returns on investment over a period of time.
Cash Flow Metrics
This is a KPI metric that is suitable for private equity or real estate. You can look for:
- Operating Cash Flow and
- Free Cash Flow
Stronger and more consistent cash flow figures indicate that the firm is doing quite well.
How do you apply these KPI metrics to your investment portfolios?
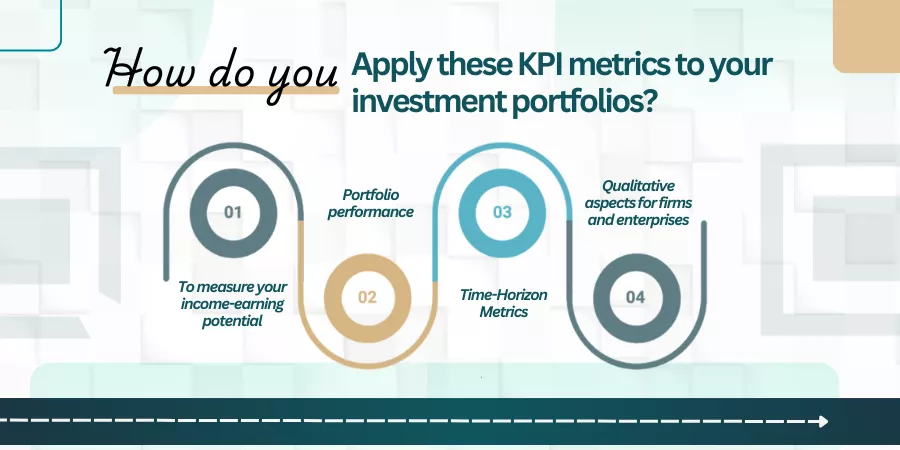
Here are ways and means by which you can evaluate KPI metrics across your investment portfolios. Here is a rundown that pertains to the same:
To measure your income-earning potential across investment portfolios
Using RoI and NPV, you can measure how much income you can passively earn throughout the tenor of your investment portfolios. For instance, if your ROI on Bonds is 10% pa and your initial deposit is $10,000, you would receive coupon payouts worth $1000 annually. ROI and NPV can also be utilized as capital budgeting ratios from the enterprise’s point of view.
Portfolio performance
Investors can look for Alpha ratios and Sharpe ratios to know how well-balanced their investment portfolios are against a fleet of market risks. Here, you get defining metrics that can gauge the portfolio performance of your investments.
Time-Horizon Metrics
Annualized Returns and IRR prove useful insights to determine long-term investment portfolios for investors as such.
Qualitative aspects for firms and enterprises
Apart from KPI indicators, the qualitative aspects of how firms and enterprises behave are also factors that should typically be taken into account by investors. Here, you look at how well the management functions to keep employees, stakeholders, or shareholders happy and well-contented. You look at whether these enterprises adapt to changing trends to design goods or services for consumers.
The Bottom Line
You must look at qualitative and quantitative aspects of how well enterprises are performing before you decide to invest your money in each one of them. You must learn the pros and cons of every investment scheme before you decide to sign on the dotted line. Above all, you must evaluate the risk factors that are involved while you sign up for investments. What are your thoughts on this? Do mention it in the comments below!
Frequently Asked Questions or FAQs

How do you sign up with an investment firm?
Answer: You monitor the Key performance indicators of the organization. You look for client testimonials from people who have worked here in the past. Plus, you look at how the resources of the organization are managed effectively. This way, you assess the efficiency of a firm and sign up for investment options.
How crucial is it for you to inform reporting figures or analytics of a firm?
Answer: The reporting analysis indicates an overview of how the investment company has been performing to date. You also get a rough idea as to whether you can participate in investment initiatives the company offers to investors. The profit or loss figures and balance sheet estimates enable you to decide if this is the platform you would be signing up for.
How do you analyze the overall efficiency of a firm?
Answer: You should look for relevant KPIs that match with the returns you would want to achieve on investment portfolios. This is in terms of helping you leverage passive earning options in the form of coupons or dividend payouts. You also look for the overall transparency of the firm to reveal its figures. Plus, you look for acquisitions or merger deals clinched by a firm accordingly. If each of these measures is zero, then the overall efficiency of the firm is also below average.