
Introduction
Would you love to analyze commonly used Insurance KPI And Metrics That are extensively used across insurance domains?
Then yes, you have pretty much come to the right place indeed. Here, we would not just cover the kpi metrics or the formulae alone, the light would also be thrown on how the formula helps identify key metrics across insurance domains.
Is your service provider on a loss-making spree or is it running on a profitable mode?
Come on, let us move on to discover Insurance KPI And Metrics on a more detailed note. Helping you get started further:
Insurance Loss Ratio
Insurance Loss Ratio is a formula to identify whether an insurance firm is making profits or is it at a loss-making operandum. This way, you would be able to determine if you can further sign up with this particular brand or not.
The Insurance Loss Ratio represents a percentage of premiums a company or a service provider pays out to its customers or members via claims.
When the percentage is lower, then the brand is moving into a profitable mode. When the Insurance loss ratio is higher, then this particular firm is paying out way more claims than it can handle.
Here is the formula pertaining to the same:

Image Courtesy: https://www.googleimages.com
Expense Ratio
The Expense ratio is a kpic metric that determines how well is an insurance service provider able to manage its operating expenses on the whole. Operational expenses relate to:
- Disbursement of salaries to staff members
- Payment of office rent or lease out advance money
- Renovation of the office in terms of adding furniture, plants, and other aesthetics
- Providing refreshments to members and staff
The Insurance Expense Ratio has to be maintained lower as it indicates that the firm is well equipped to handle its operating expenses efficiently and predominantly responsible for a better cost control of the firm that is being set up. The lower expense ratio therefore leads to better profitability for the firm indeed.
Here is the formula for computing the Expense Ratio

Image Courtesy: https://www.googleimages.com
Combined Ratio
Here, a combined ratio is a ratio that combines Insurance Expense as well as the Insurance Loss ratios. This is a ratio that also represents itself as the key indicator of a firm in maintaining its overall level of profitability on a considerable note indeed.
When a combined ratio is within 100 percent, then it represents underwriting profit for an insurance firm. While a combined ratio of over 100 percent indicates underwriting losses for the same firm.
Here is the formula by which a Combined Ratio is derived at:

Image Courtesy: https://www.googleimages.com/
Customer Retention Rate
The customer retention rate is a metric that determines the percentage of customers an insurance company can maintain over a given period of time.
In other words, the metric determines how many loyal customers stay committed to this particular insurance brand on the whole.
When the customer retention firm of an insurance company is higher, then you can rest assured that the brand is committed to serving customers and the customers are satisfied and loyal to the company too.
This way, you reduce the need for procuring an expensive form of customer acquisition.
Here is the formula for calculating your customer retention rate:

Image Courtesy: https://www.googleimages.com/
New Business Growth
New Business Growth relates to an insurance metric that indicates the percentage of new customers or members who have been added to an insurance service firm afresh. The kpi metric also takes into account the new policies that have been rolled out by the said insurance firm.
This is a metric that reflects how well is an insurance service provider able to attract a new gamut of consumers into its domain and expand business cum growth opportunities for the brand as such.
Here is the formula to measure the same:

Image Courtesy: https://www.googleimages.com
Claims Frequency
Claims Frequency refers to the number of claims that are filed by insurance policyholders over a given period of time.
A higher Claims Frequency ratio indicates a greater number of customers who are filing their claims over a specific point of time. When too many people file their claims at once, this can affect the overall profitability of the insurance company by a considerable note indeed.
Here is how the formula goes for the computation of a ‘Claims Frequency Ratio’:
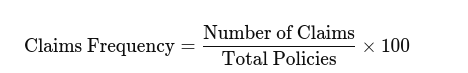
Image Courtesy: https://www.googleimages.com/
Claims Severity Ratio
The Claims Severity Ratio measures the overall severity of a claim. This ratio measures the average size of a claim providing better insights into what the risk levels are.
This way, you are also able to assess the size of each risk claim that is done by policyholders.
A claim severity ratio helps an outsider determine how efficient a brand is in handling high-end claims of policyholders in an efficient and streamlined manner.
Here is a formula computation on how an average cost of a claim is being worked out:

Image Courtesy: https://www.googleimages.com/
Returns on Equity or ROE
The Return on Equity determines how efficiently is the insurance service provider in the generation of profits from shareholder’s equity funds.
The higher the service provider generates its ROE, the better profits it garner from the equity funds of shareholders.
Here is the formula computation on how the Returns on Equity or the ROE is worked with:

Image Courtesy: https://www.googleimages.com/
Solvency Ratio
Solvency Ratio is a type of ratio that measures the overall strength of an insurance company or a brand on the whole.
Policyholders, shareholders, and other stakeholders use this ratio to determine how powerful an insurance company is, with its ability to meet its financial obligations.
When you have a higher solvency ratio, the better is the financial strength of an insurance firm in terms of meeting its financial obligations.
Therefore, this is an indicator that represents better financial stability, and looking for this kind of firm is a great choice indeed.
Here is the formula that is used to calculate the solvency ratio:

Image Courtesy: https://www.googleimages.com/
Underwriting Profit
An Underwriting profit primarily identifies the profit-loss ratio of taking up an underwriting business inside the insurance domain. The ratio excludes investment income on the whole.
A positive underwriting ratio suggests that the insurance service provider is able to manage risks vis-a-vis expenses effectively.
Here is the formula for the computation of the same:![]()
Image Courtesy: https://www.googleimages.com/

Claims Resolution Time
Claims resolution time refers to a metric of calculating the average time an insurance company would take to settle the claims of a said policyholder.
The shorter the claim resolution, the better the efficiency of the customer support and relationship management teams of said insurance company.
Here is the formula for the computation of the same:

Image Courtesy: https://www.googleimages.com/
Loss Adjustment Expense Ratio
The Loss Adjustment Expense Ratio can also be abbreviated as LAE Ratio.
The LAE ratio measures the costs that are involved with the following:
- Recurring costs of investigation
- The costs that are associated with the settlement of claims for policyholders
When you have a higher LAE ratio, it indicates that a larger proportion of the premiums that are collected by an insurer is utilized in settling claims of policyholders and this can impact the overall profit-making reserves of the firm as such.
Here is the formula for the computation of an LAE ratio:

Image Courtesy: https://www.googleimages.com/
Net Promoter Score or NPS
The Net Promoter Score or the NPS scores reveal how satisfied the customers of an insurance company are.
This is a direct indicator that reveals how strong the insurance brand is and reflects how happy its customers are.
The firm with a higher NPS score would have customers who are more likely to recommend their friends or business colleagues to your firm as such.
Here is the formula by which the NPS scores are being tabulated:

Policyholder growth
This is a KPI metric that measures how an insurance company is able to expand its customer base over a given period of time.
A positive policyholder growth rate reveals how satisfied and positive a consumer base is with the insurance firm and this is a metric that reveals how successful are you as an insurance brand.
Here is the formula by which the policyholder growth rate is being computed:

Image Courtesy: https://www.googleimages.com/
The Bottom Line
These are the different varieties of Insurance KPIs and Metrics that insurance companies use at different stages of their inception.
Favorable ratios of the metrics reveal how profitable an insurance company is, and how happy the brand keeps its consumer base.
Above all, these metrics reveal how effectively insurance companies handle their scale of operations while handling risk factors too.
What are your thoughts on this? Do mention it in the comments below!
Frequently Asked Questions or FAQs
What are some of the key performance indicators that are used to track the performance of the insurance industry on the whole?
Answer: The insurance Loss Ratio, Insurance Expense Ratio, Combined ratio, Customer retention rate, and Claims handling rates are some of the key indicators that reveal the performance efficiency, operating efficiency, and service excellence of an insurance brand as such.
Can a heavy marketing campaign improve the revenue margin or customer satisfaction levels of an insurance brand? Explain.
Answer: Yes, a marketing campaign might improve the brand awareness and familiarize more customers to take up policies from a brand as such. However, the benchmark is the service excellence or competitive rates a brand gives to help customers get better value for their money.
Are KPI metrics mainly data-driven?
Answer: The objective of monitoring the performance of gross values is to check if the operational, administrative, and service excellence of a brand is going in a smooth direction or not.
You do have software to monitor performance of strategic indicators via online or automated software. This way, you strive to optimize analytics on the dashboard in an enhanced note indeed.